
A Benchmark for a Mono and Multi
Objective Optimization of the Brushless DC Wheel Motor
|
|
A Benchmark for a Mono and Multi
Objective Optimization of the Brushless DC Wheel Motor |
||||
| |
| Mono-objective optimization
Results of mono-objective optimization are given in table 1. It represents the method, the optimal value of the design variables, the efficiency, the number of evaluations of the objective function and the constraints. Clicking on the name of the method, a description of the method appears with the authors name and associated references. Table 1– Comparison of the mono-objective optimization results.
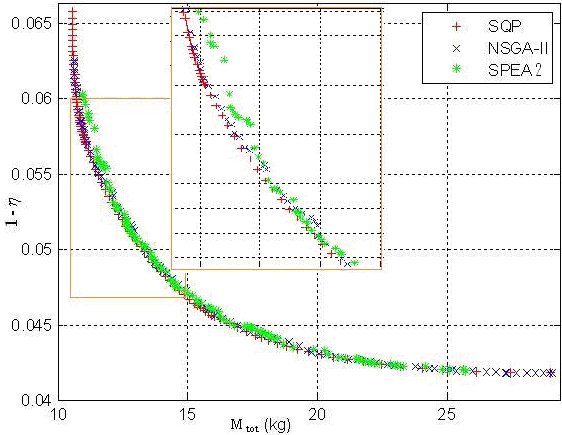
Multi-objective optimization Results of multi-objective optimization are given in table 2. It represents the method, the average and standard deviations of three performance metrics for 100 runs, the number of evaluations of the objective function. Clicking on the name of the method, a description of the method appears with the authors name and associated references. Clicking on the name of the metric, a description appears. The Pareto front obtained by the variable weighted sum of objectives with SQP is taken as the reference set. Table 2 – Comparison of the multi-objective optimization results.
Fig.3– Pareto front found with the all SQP, NSGA-II, and SPEA2.
|
|||||||||||||||||||||||||||||||||||||||||||||||||||||||||||||||||||||||||||||||||||||||||||||||||||||||||||||||||||||||||||||||||||||
| Home • Analytical Model • Optimization Problem •Optimization Results •Contact/Submit |