


|
Multi-Level Optimization
|
|
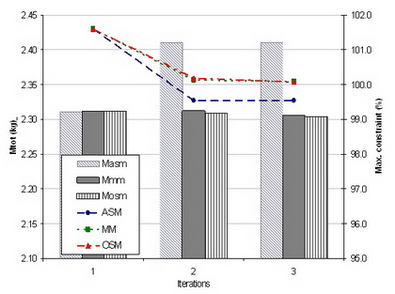
Optimization results reached by different multi-level algorithms are given in Table III (methods, optimal values of design variables, total mass, number of evaluations of both models and maximal obtained constraint). Clicking on the name of the method, a description of this method appears with the authors name and associated references. Clicking on the value of the maximal constraint, the value of each constraint is given. Fig. 5 shows the convergence histories of ASM comparing with MM and OM algorithms. In Fig. 5, the maximal constraint is plotted with lines and values can be read from the right axis. The total mass is plotted using histograms and the values can be read from the left axis. Table III
Fig. 5. Convergence histories of ASM, OM and MM algorithms after 3 iterations
|


|
Methods |
a, mm |
b, mm |
c, mm |
d, mm |
n1 |
S1, mm2 |
S2, mm2 |
Mtot, kg |
Model |
Evals
|
Max. constraint |
|
|
12.92 |
50.12 |
16.61 |
43.26 |
640.77 |
0.325 |
2.912 |
2.311 |
Analytical
|
108
|
|
|
FEA |
1
|
|
|||||||||
|
12.84
|
51.39
|
16.90
|
42.98
|
653.80
|
0.323
|
3.020
|
2.343
|
FEA |
2
|
|
|
|
12.98
|
50.37
|
16.55
|
42.71
|
629.89
|
0.331
|
2.976
|
2.301
|
FEA |
6
|
|
|
|
14.94
|
48.43
|
15.64
|
38.27
|
611.78
|
0.310
|
2.787
|
2.294
|
FEA
|
44
|
||
|
12.98
|
50.35
|
16.57
|
42.81
|
631.48
|
0.330
|
2.969
|
2.306
|
FEA
|
3
|