

|
Comparison of Models |
|
Parameters |
Analytical model |
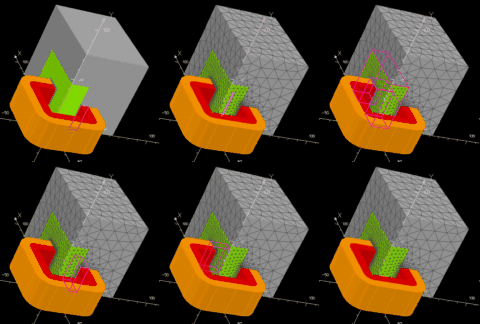
3D FEA |
||
|
Primary resistor |
r1 |
Ω |
7.763 |
8.088 |
|
Secondary resistor |
r2 |
Ω |
0.158 |
0.166
|
|
Primary leakage inductance |
l1 |
mH |
17.040 |
16.980
|
|
Second. leakage inductance |
l2 |
mH |
0.280 |
0.245
|
|
Primary current |
I1 |
A |
0.981 |
0.947
|
|
Magnetizing current |
Iμ |
mA |
83.817 |
66.553
|
|
Magnetizing inductance |
Lμ |
H |
8.846 |
10.214 |
|
Maximal induction |
Bm |
T |
1.438 |
1.281
|
|
Copper loss |
Pco |
W |
16.623 |
17.573
|
|
Iron loss |
Pir |
W |
3.048 |
2.490
|
|
Copper temperature |
Tco |
oC |
107.40 |
125.59
|
|
Iron temperature |
Tir |
oC |
96.18 |
94.81
|
|
Efficiency |
η |
% |
88.60
|
88.13 |
|
Voltage drop |
DV2 |
V |
2.424 |
2.736
|
|
Computational time |
t |
s |
0.5 |
6942.6 |
|
The specifications of the set-down transformer selected for comparison have: power 192 VA; primary voltage 230 V; secondary voltag 24 V; power factor 0.8; ambient temperature 40°C; copper density 8800 kg.m-3; iron density 7800 kg.m-3; resistivity of copper 1.6.10-8 Ω
The results of both models with a selected configuration are presented in table I. 3D FE model is more accurate but requires a great amount of time because of the magneto-thermal coupling. The results of the analytical model are rather close to those of 3D FEA. The weakest points of the analytical model are the assumption of uniform temperature in copper and iron, and the computation of the leakage inductances. Table I
|
